
East Asian Arch Psychiatry 2022;32:89-94 | https://doi.org/10.12809/eaap2219
ORIGINAL ARTICLE
Jing Ling Tay, Institute of Mental Health, Buangkok Green Medical Park, 10 Buangkok View, Singapore 539747
Address for correspondence: Jing Ling Tay, Institute of Mental Health, Buangkok Green Medical Park, 10 Buangkok View, Singapore 539747.
Email: jing_ling_tay@imh.com.sg
Submitted: 21 March 2022; Accepted: 31 October 20222
Abstract
Objectives: The study aims to examine the reliability and validity of the Personal Stigma Scale and the intrapersonal variables that affect the personal stigma level towards depression among university students in Singapore.
Methods: University students aged 18 to 24 years old who were literate in English were recruited using convenience sampling through online platforms. Participants’ stigma towards depression was assessed using the Personal Stigma Scale. Each item of the scale was rated from 1 (strongly disagree) to 5 (strongly agree); higher scores indicate higher stigmatising attitudes. Internal consistency, divergent validity, construct validity, and test-retest reliability of the Personal Stigma Scale were evaluated, as were the intrapersonal variables that affect the personal stigma level towards depression.
Results: Personal stigma level was significantly lower in female participants, those from healthcare faculties, those with prior contact with healthcare professionals, those without mental health disorders, and those with loved ones with mental health disorders. Exploratory factor analysis revealed a three- factor structure. The Personal Stigma Scale was negatively correlated with the Depression Literacy Scale weakly and the Anxiety Literacy Scale moderately. Cronbach’s alpha for internal consistency was0.71 for the overall scale and 0.18 to 0.67 for subscales. Test-retest reliability coefficient was 0.74 at2 weeks and 0.70 at 2 months.
Conclusion: The Personal Stigma Scale is valid and reliable to measure self-stigma towards depression among university students in Singapore. Nonetheless, further studies are required to examine its factor structure, especially among various cultures and populations.
Key words: Depression; Factor analysis, statistical; Psychometrics; Reproducibility of results; Social stigma
Introduction
According to a systematic review of 16 longitudinal studies, public attitude towards those with mental disorders worsens despite increased mental health literacy and acceptance of formal treatment.1 This negative attitude is termed stigma, which consists of three components: stereotype, prejudice, and discrimination.2 Stereotyping is the negative labelling of people with mental health disorders such as ‘dangerous’, ‘weak’, and ‘incompetent’.2,3 Prejudice is the negative emotions (such as anger or fear) associated with stereotype. Discrimination refers to the specific actions against people with mental health disorders such as avoidance and withholding help and opportunities. These may cause status loss and extreme isolation of the people with mental health disorders and may result in poor interpersonal relationships, low self-esteem, poor emotional well-being, reduced hope, bullying, and physical violence.4-7 Patients with mental disorders are commonly misunderstood to be violent, difficult to predict, and aggressive.8
In Asian countries, families tend to hide their members with mental health disorders in shame. In Singapore, 44.5% of 940 youths aged 14 to 18 years reported having used derogatory terms to describe mental disorders, despite 22.6% of the youths having participated in campaigns about mental health awareness; common terms used include depression (20.2%), different (15.9%), crazy (18.7%), and weird (13.1%).9 This causes self- stigma, as people with mental health disorders internalise all these negative thoughts and attitudes and feel depressed, shameful, and worthless. These result in greater risks of relapses, homelessness, unemployment, and diminished quality of life and recovery.10 Intrapersonal variables that affect stigma levels include age, sex, ethnicity, and cultural differences.11-13
The prevalence of mental health disorders among youths is about 20%.14 The period of youth accounts for the onset of 75% of all mental health disorders.15 In Singapore, suicide is the leading cause of death among youths.16 Depression is the most prevalent mental health disorder. Psychometric properties of the Depression Stigma Scale have been evaluated.17-19 The scale has a test-retest reliability of 0.71 and internal consistency of 0.75 to 0.82,17,19,20 but its factor structure varies in different studies.21-23
This study aims to examine the reliability and validity of the Personal Stigma Scale and the intrapersonal variables that affect the personal stigma level towards depression among university students in Singapore.
Methods
This study was approved by the institutional review board of the National University of Singapore (reference: S-19- 251). Written informed consent was obtained from each participant. In February 2020, university students aged 18 to 24 years who were literate in English were recruited using convenience sampling through online platforms of the university, Instagram, Facebook, and Forums. Those with reading or hearing disabilities were excluded.
The Personal Stigma Scale is adapted from the Depression Stigma Scale and customised for university students by omitting the item: “I would not employ someone if I knew they had a problem like John’s”.24
Participants’ stigma towards depression was measured using the Personal Stigma Scale, which comprises seven items in two subscales: personal dangerous/unpredictable and personal weak-not-sick.24 Each item was rated from 1 (strongly disagree) to 5 (strongly agree); higher scores indicate higher stigmatising attitudes.
A sample size of 80 per group was required for evaluating validity.25 The open statistical software Jamovi was used to evaluate confirmatory factor analysis. One-way analysis of variance was used to determine the association between personal stigma levels and intrapersonal variables. Cronbach’s alpha was used to evaluate internal consistency. Test-retest reliability was evaluated after an interval of 2 weeks and then 2 months using Pearson’s correlation. Divergent validity was tested with the Depression Literacy Scale and the Anxiety Literacy Scale, because stigma levels were in part due to low mental health literacy levels and hence poor help-seeking. Construct validity was established with confirmatory / exploratory factor analysis. Exploratory factor analysis was examined using the principal component and varimax rotation. The sample adequacy was evaluated using the Kaiser-Meyer-Olkin test. Items with loadings of >0.4 and factors with eigenvalues of 1 were considered acceptable.
Results
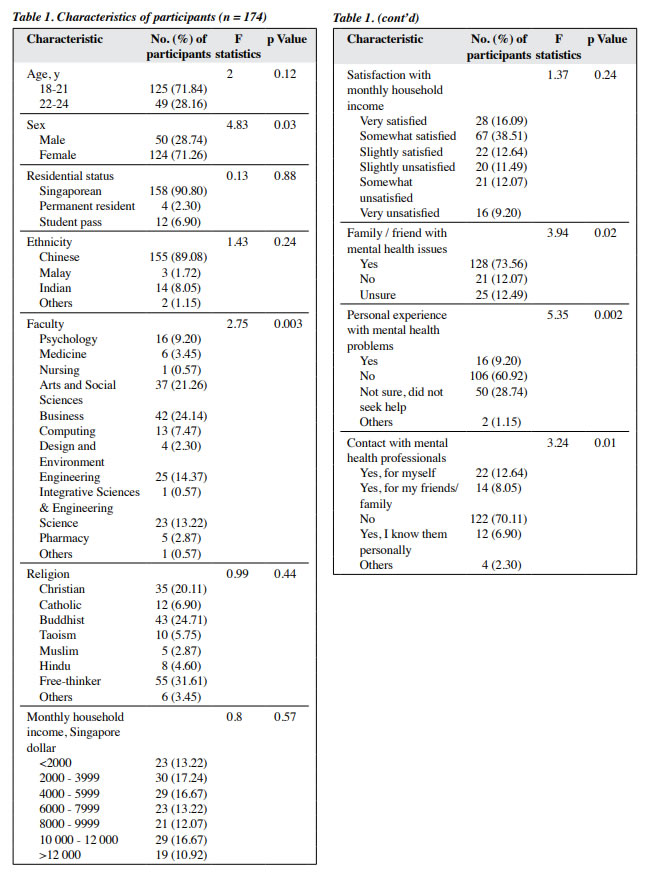
A total of 174 participants (78 in the first group and 96 in the second group) aged 18 to 24 years old completed the baseline questionnaire (Table 1). The mean personal stigma score for depression was 15.77 ± 3.79 in the first group and 16.55 ± 3.99 in the second group. Women had lower personal stigma level than men (15.79 ± 3.99 vs 17.22 ± 3.56, F = 4.83, p = 0.03). Participants from healthcare faculties such as psychology (n = 16), medicine (n = 6), pharmacy (n = 5), and nursing (n = 1) had lower personal stigma level (16.2 ± 3.1) than those from other faculties (F = 2.75, p = 0.003). Participants with prior contact with mental health professionals had lower personal stigma level (16.2 ± 3.91) than those without prior contact (F = 3.24, p = 0.01). Participants who personally knew any healthcare professionals (n = 12) had the lowest personal stigma level (13.33 ± 3.52), whereas participants who did not know any healthcare professionals (n = 122) had the highest personal stigma level (16.77 ± 3.94). The personal stigma level was comparable between those with and without mental health disorders (16.56 ± 2.31 vs 16.97 ± 3.67) but was lower in those who were unsure and did not seek professional help (14.52 ± 4.29). Participants who were unsure whether their friends / family members had mental health problems had highest personal stigma level (17.88 ± 3.48), followed by participants whose friends / family members did not have mental health problems (17.1 ± 3.87). Participants who had friends / family members with mental health problems had lowest personal stigma level (15.72 ± 3.9). There were no significant differences in personal stigma level in terms of the residential status, ethnicity, religion, monthly household income, and satisfaction with monthly household income.
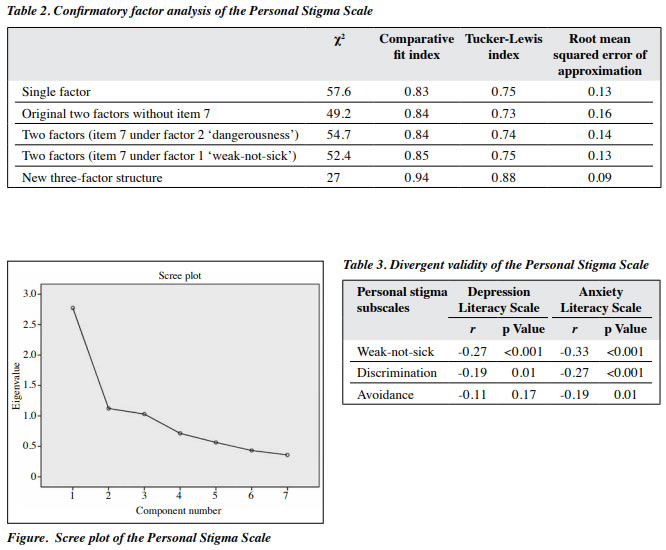
In exploratory factor analysis using varimax rotation, the Personal Stigma Scale had a three-factor structure. The correlation matrix demonstrated that all coefficients were >0.4. The Kaiser-Meyer-Olkin value was acceptable (0.75), the Bartlett test of sphericity result was significant (p < 0.001), and the communalities range was acceptable (0.61-0.76). In principal component analysis, the three factors had an eigenvalue of >1.0 (2.77, 1.12, and 1.03) and explained 39.63%, 16.04%, and 14.73% of the variance, respectively (Figure).
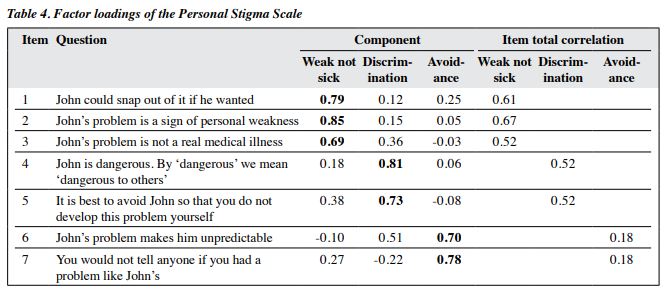
In confirmatory factor analysis, the Personal Stigma Scale was forced into a one-factor structure and then into the original two-factor structure (Table 2). The original two factors consisted of ‘weak-not-sick’ (items 1, 2, 3, and 5) and ‘dangerousness’ (items 4 and 6) factors, with item 7 excluded. Item 7 was then included under factor 2 (dangerousness) and then under factor 1 (weak-not-sick). In the exploratory factor analysis, the new three-factor structure yielded the best fit for confirmatory factor analysis and consisted of factor 1 (items 1, 2, and 3), factor 2 (items 4 and 5), and factor 3 (items 6 and 7).
For divergent validity, the total item of the Personal Stigma Scale was negatively correlated with the Depression Literacy Scale mildly (r = -0.27, p < 0.001) and the Anxiety Literacy Scale moderately (r = -0.36, p < 0.001) [Table 3].
The Cronbach’s alpha for internal consistency of the Personal Stigma Scale was 0.71. Respectively for the weak-not-sick, discrimination, and avoidance subscales, the Cronbach’s alpha was 0.76, 0.66, and 0.36, whereas the item total correlation was 0.52 to 0.67, 0.52, and 0.18 (Table 4). The test-retest reliability of the 78 participants in the first group was 0.74 at 2 weeks and 0.70 at 2 months.
Discussion
Female university students in Singapore had significantly lower personal stigma levels than their male counterparts. This is congruent with findings from Australia17,19,24,26,27 and Singapore.28 However, in Arab, there are no differences in personal stigma levels between sexes.29 Culture plays an important role in the perception of stigma towards mental disorders and affects the predicting value of sex for personal stigma. Women tend to be more emotionally aware and were more willing to share about their mental health symptoms and therefore have better knowledge about depression.30-33 In men, the perception of weakness associated with depression may cause higher personal stigma levels.
Students from healthcare faculties with mental health modules had lower personal stigma levels. Those not sure whether they had mental health disorders and did not seek help had lower personal stigma levels than those without mental health disorders. This is in contrast to findings from Arab29 and Australia26 where those without mental health disorders have higher stigma level. The difference was likely due to inclusion of the ‘unsure’ option in our study.
Participants with friends / family members with mental health disorders had lower personal stigma levels. This is congruent with findings from Australia17,34 and Canada35 but not so in other study.29 Contact with people with mental health disorders enables positive connections and interactions and reduces distrust and divide.36 Similarly, contact interventions are proven to reduce stigma levels.37
In confirmatory factor analysis, the Personal Stigma Scale was the best fit for the new three-factor structure that include the original weak-not-sick factor as well as discrimination and avoidance factors. The differences in the structure are likely attributable to cultural differences between Singapore and Australia. Public attitude towards mental health disorders was better in western countries than in Asian countries, probably owing to better mental health literacy in western countries.
Younger people have less stigmatising attitude,17,27 probably owing to better mental health literacy. In Singapore, people of Indian ethnicity have higher stigma levels,28 but the present study did not duplicate this finding, probably because the sample size of Indian participants was too small (n = 8) to detect differences.
In a study of 1693 participants in Portugal, the Depression Stigma Scale has a three-factor structure: weak- not-sick (items 1-3), dangerousness / unpredictable (items 4-6), and discrimination (items 7-9).23 Although the present study also found a three-factor structure, the items were loaded differently under each factor. This reflects the effect of cultural differences on the perception of stigma.
In the present study, the Personal Stigma Scale was negatively correlated with the Depression Literacy Scale weakly and the Anxiety Literacy Scale moderately. Similarly, in Australia, participants with lower personal weak-not-sick subscale have higher mental health literacy scores.38 Therefore, those with higher mental health literacy tend to consider people with mental health symptoms to be ill rather than weak. Nonetheless, higher mental health literacy did not encourage participants to be more forthcoming with any mental health conditions or to perceive people with mental health conditions as normal.
In the present study, the Cronbach’s alpha for weak- not-sick (0.76) and discrimination (0.66) subscales was acceptable, but that for avoidance subscale was unacceptable (0.36). Item total correlation for the avoidance subscale was also poor. This corresponds with studies that show the two-factor structure for the Personal Stigma Scale.22,28 In a Singapore study, the Cronbach’s alpha was 0.55 for the weak-not-sick subscale and 0.66 for the dangerousness- undesirable subscale.28 In an Australia study, the Cronbach’s alpha ranges from 0.66 to 0.79.19 In a Portugal study, the Cronbach’s alpha is 0.7.23 More studies are required to determine whether a two- or three-factor structure is best fit for the scale.
There are limitations to the present study. Participants were recruited from one university only in Singapore; findings may not be generalisable to the general population. The cross-sectional design of the study does not allow causal inferences. The use of convenience sampling may result in selection bias. Self-reported outcome measurements may reduce the credibility of the findings owing to social desirability bias and recall bias. However, data were collected online, and any undue influence from researchers was minimised. Future research should explore the structure of the Personal Stigma Scale in other Asia countries or other populations in Singapore, as cultural differences affect the perceptions of mental disorders and the construct of stigma. It is important to establish various constructs of stigma for various populations to accurately interpret stigma before implementing specific interventions to reduce stigma.39. Further research should also explore the association between mental health literacy and stigma, because higher mental health literacy to reduce stigma was not consistently demonstrated.
Conclusion
The Personal Stigma Scale is reliable and valid to measure self-stigma towards depression among university students in Singapore. Nonetheless, further studies are required to examine its factor structure, especially among various cultures and populations.
Contributor
The author designed the study, acquired the data, analysed the data, drafted the manuscript, and critically revised the manuscript for important intellectual content. The author had full access to the data, contributed to the study, approved the final version for publication, and takes responsibility for its accuracy and integrity.
Conflicts of interest
The author has disclosed no conflicts of interest.
Funding/support
This study received no specific grant from any funding agency in the public, commercial, or not-for-profit sectors.
Data availability
All data generated or analysed during the present study are available from the corresponding author on reasonable request.
Ethics approval
This study was approved by the institutional review board of the National University of Singapore (reference: S-19-251).
References
- Schomerus G, Schwahn C, Holzinger A, et al. Evolution of public Acta Psychiatr Scand 2012;125:440-52. Crossref
- Corrigan PW, Watson AC. Understanding the impact of stigma on people with mental illness. World Psychiatry 2002;1:16-20.
- Link BG, Phelan JC. Conceptualizing stigma. Annu Rev Sociol 2001;27:363-85. Crossref
- Sickel AE, Seacat JD, Nabors NA. Mental health stigma update: a review of consequences. Adv Mental Health 2014;12:202-15. Crossref
- Henderson C, Gronholm PC. Mental health related stigma as a ‘wicked problem’: the need to address stigma and consider the consequences. Int J Environ Res Public Health 2018;15:1158. Crossref
- Corrigan PW, Druss BG, Perlick DA. The impact of mental illness stigma on seeking and participating in mental health care. Psychol Sci Public Interest 2014;15:37-70. Crossref
- Bipeta R, Yerramilli SSRR, Pillutla SV. Perceived stigma in remitted psychiatric patients and their caregivers and its association with self- esteem, quality of life, and caregiver depression. East Asian Arch Psychiatry 2020;30:101-7. Crossref
- Pescosolido BA, Jensen PS, Martin JK, Perry BL, Olafsdottir S, Fettes D. Public knowledge and assessment of child mental health problems: findings from the National Stigma Study-Children. J Am Acad Child Adolesc Psychiatry 2008;47:339-49. Crossref
- Pang S, Liu J, Mahesh M, et al. Stigma among Singaporean youth: a cross-sectional study on adolescent attitudes towards serious mental illness and social tolerance in a multiethnic population. BMJ open 2017;7:e016432. Crossref
- Chronister J, Chou CC, Liao HY. The role of stigma coping and social support in mediating the effect of societal stigma on internalized stigma, mental health recovery, and quality of life among people with serious mental illness. J Community Psychol 2013;41:582-600. Crossref
- Curcio C, Corboy D. Stigma and anxiety disorders: a systematic review. Stigma Health 2020;5:125-37. Crossref
- Kalisova L, Michalec J, Hadjipapanicolaou D, Raboch J. Factors influencing the level of self-stigmatisation in people with mental illness. Int J Soc Psychiatry 2018;64:374-80. Crossref
- Min JW. The influence of stigma and views on mental health treatment effectiveness on service use by age and ethnicity: evidence from the CDC BRFSS 2007, 2009, and 2012. SAGE Open 2019;9:2158244019876277. Crossref
- World Health Organization. The World Health Report 2001: Mental Health: New Understanding, New Hope. World Health Organization; 2001.
- Kessler RC, Amminger GP, Aguilar-Gaxiola S, Alonso J, Lee S, Ustun TB. Age of onset of mental disorders: a review of recent literature. Curr Opin Psychiatry 2007;20:359-64. Crossref
- Samaritans of Singapore. Learn About Suicide- Quick Facts 2022. Available from: https://www.sos.org.sg/learn-about-suicide/quick- facts.
- Griffiths KM, Christensen H, Jorm AF. Predictors of depression stigma. BMC Psychiatry 2008;8:25. Crossref
- McGrath M, Duncan F, Dotsikas K, et al. Effectiveness of community interventions for protecting and promoting the mental health of working-age adults experiencing financial uncertainty: a systematic review. J Epidemiol Community Health 2021;75:665-73. Crossref
- Griffiths KM, Christensen H, Jorm AF, Evans K, Groves C. Effect of web-based depression literacy and cognitive-behavioural therapy interventions on stigmatising attitudes to depression: randomised controlled trial. Br J Psychiatry 2004;185:342-9. Crossref
- Griffiths KM, Nakane Y, Christensen H, Yoshioka K, Jorm AF, Nakane H. Stigma in response to mental disorders: a comparison of Australia and Japan. BMC Psychiatry 2006;6:21. Crossref
- Conceição V, Rothes I, Severo M, Griffiths K, Hegerl U, Gusmão R. Psychometric properties of the Depression Stigma Scale in the Portuguese population and its association with gender and depressive symptomatology. Health Qual Life Outcomes 2022;20:42. Crossref
- Zhu L, Yao J, Wu L, et al. Psychometric properties of the Depression Stigma Scale (DSS) in Chinese cancer patients: a cross-sectional study. BMJ Open 2019;9:e028429. Crossref
- da Conceicao V, Rothes I, Severo M, Griffiths K, Hegerl U, Gusmao R. Depression Stigma Scale in the Portuguese population: psychometric properties and construct validation [preprint]. medRxiv 2020.
- Yap MB, Mackinnon A, Reavley N, Jorm AF. The measurement properties of stigmatizing attitudes towards mental disorders: results from two community surveys. Int J Methods Psychiatr Res 2014;23:49-61.Crossref
- Hobart JC, Cano SJ, Warner TT, Thompson AJ. What sample sizes for reliability and validity studies in neurology? J Neurol 2012;259:2681-94. Crossref
- Calear AL, Griffiths KM, Christensen H. Personal and perceived depression stigma in Australian adolescents: magnitude and predictors. J Affect Disord 2011;129:104-8. Crossref
- Reavley NJ, Mackinnon AJ, Morgan AJ, Jorm AF. Stigmatising attitudes towards people with mental disorders: a comparison of Australian health professionals with the general community. Aust N Z J Psychiatry 2014;48:433-41. Crossref
- Subramaniam M, Abdin E, Picco L, et al. Stigma towards people with mental disorders and its components: a perspective from multi-ethnic Singapore. Epidemiol Psychiatr Sci 2017;26:371-82. Crossref
- Dardas LA, Silva SG, Smoski MJ, Noonan D, Simmons LA. Personal and perceived depression stigma among Arab adolescents: associations with depression severity and personal characteristics. Arch Psychiatr Nurs 2017;31:499-506. Crossref
- Tay JL, Goh YS, Klainin-Yobas P. Online HOPE intervention on mental health literacy among youths in Singapore: an RCT protocol. J Adv Nurs 2020;76:1831-9. Crossref
- Tay JL, Goh YSS, Sim K, Klainin-Yobas P. Impact of the HOPE intervention on mental health literacy, psychological well-being and stress levels amongst university undergraduates: a randomised controlled trial. Int J Environ Res Public Health 2022;19:9772. Crossref
- Swami V. Mental health literacy of depression: gender differences and attitudinal antecedents in a representative British sample. PLoS One 2012;7:e49779. Crossref
- Townsend L, Musci R, Stuart E, et al. Gender differences in depression literacy and stigma after a randomized controlled evaluation of a universal depression education program. J Adolesc Health 2019;64:472-7. Crossref
- Sheffield JK, Fiorenza E, Sofronoff K. Adolescents’ willingness to seek psychological help: promoting and preventing factors. J Youth Adolesc 2004;33:495-507. Crossref
- Wang J, Lai D. The relationship between mental health literacy, personal contacts and personal stigma against depression. J Affect Disord 2008;110:191-6. Crossref
- National Academies of Sciences, Engineering and Medicine. Ending Discrimination Against People with Mental and Substance Use Disorders: the Evidence for Stigma Change. National Academies Press; 2016.
- Morgan AJ, Reavley NJ, Ross A, San Too LS, Jorm AF. Interventions to reduce stigma towards people with severe mental illness: systematic review and meta-analysis. J Psychiatr Res 2018;103:120-33. Crossref
- Reavley NJ, Morgan AJ, Jorm AF. Development of scales to assess mental health literacy relating to recognition of and interventions for depression, anxiety disorders and schizophrenia/psychosis. Aust N Z J Psychiatry 2014;48:61-9. Crossref
- Siu BW, Chow KK, Lam LC, Chan WC, Tang VW, Chui WW. A questionnaire survey on attitudes and understanding towards mental disorders. East Asian Arch Psychiatry 2012;22:18-24.
